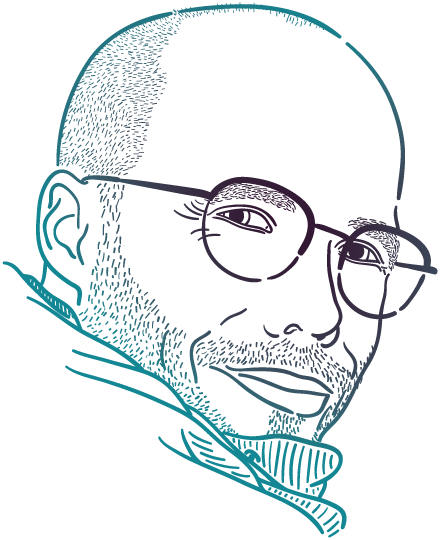
About me
My name is Philipp Jordan. I am a trained scientist with a passion for art.
I visualise complex data in science and medicine with beautiful and accurate graphics, helping my clients to engage, inform, and inspire their audiences. Explaining your science in a visually appealing and effective way is my goal.
The curiosity of how information is received, processed and transformed made me study the human cell on its molecular level as the basic unit of information processing. I studied Molecular Biomedicine (BSc) and Life and Medical Science (MSc) at the University of Bonn, followed by a Doctor of Natural Science in biochemistry at the Max-Delbrück-Centrum for molecular medicine. During my doctoral studies, I found an opportunity to combine my passion for art with my curiosity for science: I started to create illustrations for scientific posters, graphical abstracts for papers, and much more. In 2018 I took a step further and created my own company for scientific visualization JordanGraphics.
The untold story of how I came to be a scientific illustrator.
By the end of my high school education, I struggled choosing a single study program. I was fascinated by the physics of fluid dynamics which let airplanes fly, boats sail, and cars go faster and faster. It was the time bionics took off. This new idea of mimicking nature shapes and texture to create better materials and devices captivated me. Out of this fascination, my second passion – product design – grew. In my childhood I was surrounded by design classics, like the Wagenfeld lamp, the LC1 from Le Corbusier, the Tizio from Atremide and many more. I got sense for proportions and design, and soon started to design and build my own little paper planes, toothbrushes, knifes, calendars, houses, cars, boats, websites.
I grew older and tried to impress the girls with my drawings, but my art got soon out of hand. I clearly remember how my third interest – molecular biology – got me. It was an image of a protein in the biology book by Neil A. Campbell. The protein was drawn like it was in real space, in all of its beauty in 3d space including the amino acids with their residues, the polar surface showing positive and negative charged areas and hydrophobic pockets. It was the first time I saw a protein in 3D and I was immediately fascinated how the protein structure defined its function, just like the famous phrase by Loise Sullivan “forms follows function”.
Since, I could not decide for which study program I should go, I applied for all three: Fluid dynamics, product design, and molecular medicine. I got accepted at all three programmes for fluid dynamics, but in the end, I decided it was too theoretical. I spent several months preparing a portfolio for my application for product design – soon the house was flooded with sketches and illustrations. Finally, I sent it in, and waited. Weeks went by and I didn’t hear a word from them. I called to ask about my application, and their reply was something like this: “Unfortunately, there was a thunderstorm and our basement was flooded. Your work is destroyed. Would you be so kind to send us a new one, within two weeks?”
I took it as a sign and headed for my curiosity about molecular biology – how cells process all kinds of information only using proteins made from the same 22 amino acids. I went for a BSc in molecular biomedicine at the University of Bonn, followed by the Life and Medical Science master program. For my master thesis I left Bonn heading to Berlin to the Max-Delbrück-Centrum for molecular medicine (MDC). There I completed my master’s thesis and started my PhD on the interplay of the immune and nervous system – still fascinated by the information processing.
During my studies I never stopped designing and doing art. I designed the logo, website, t-shirts, and party posters for our student council. I went out with friends colouring the city – some of those artworks might be still visible in Bonn. In my PhD I helped my colleagues to improve their conference posters and illustrated their posters – some of them won poster prices. I understood what story they wanted to tell and translated them into graphics. This is where I found my passion: Translating complex scientific data into beautiful comprehensible graphics.
“In my mind
science has to make sense visually.”

